Troubleshooting issues in Datadog can be challenging. This guide will help simplify the process.
Datadog is a powerful monitoring tool for your infrastructure and applications. But, like any tool, it can encounter issues. Efficient troubleshooting in Datadog ensures your systems run smoothly and efficiently. Whether you’re dealing with missing metrics, alert problems, or integration issues, knowing how to troubleshoot effectively is vital.
In this blog post, we’ll explore common Datadog problems and practical solutions. By the end, you’ll have a better understanding of how to keep your monitoring setup robust and reliable. Let’s dive into the world of Datadog troubleshooting and make your monitoring experience seamless.
Credit: www.datadoghq.com
Common Datadog Issues
Datadog is a powerful monitoring tool. It helps teams keep track of their systems. Yet, users sometimes face common issues. These can slow down their workflow. Let’s look at a few of these issues and how to solve them.
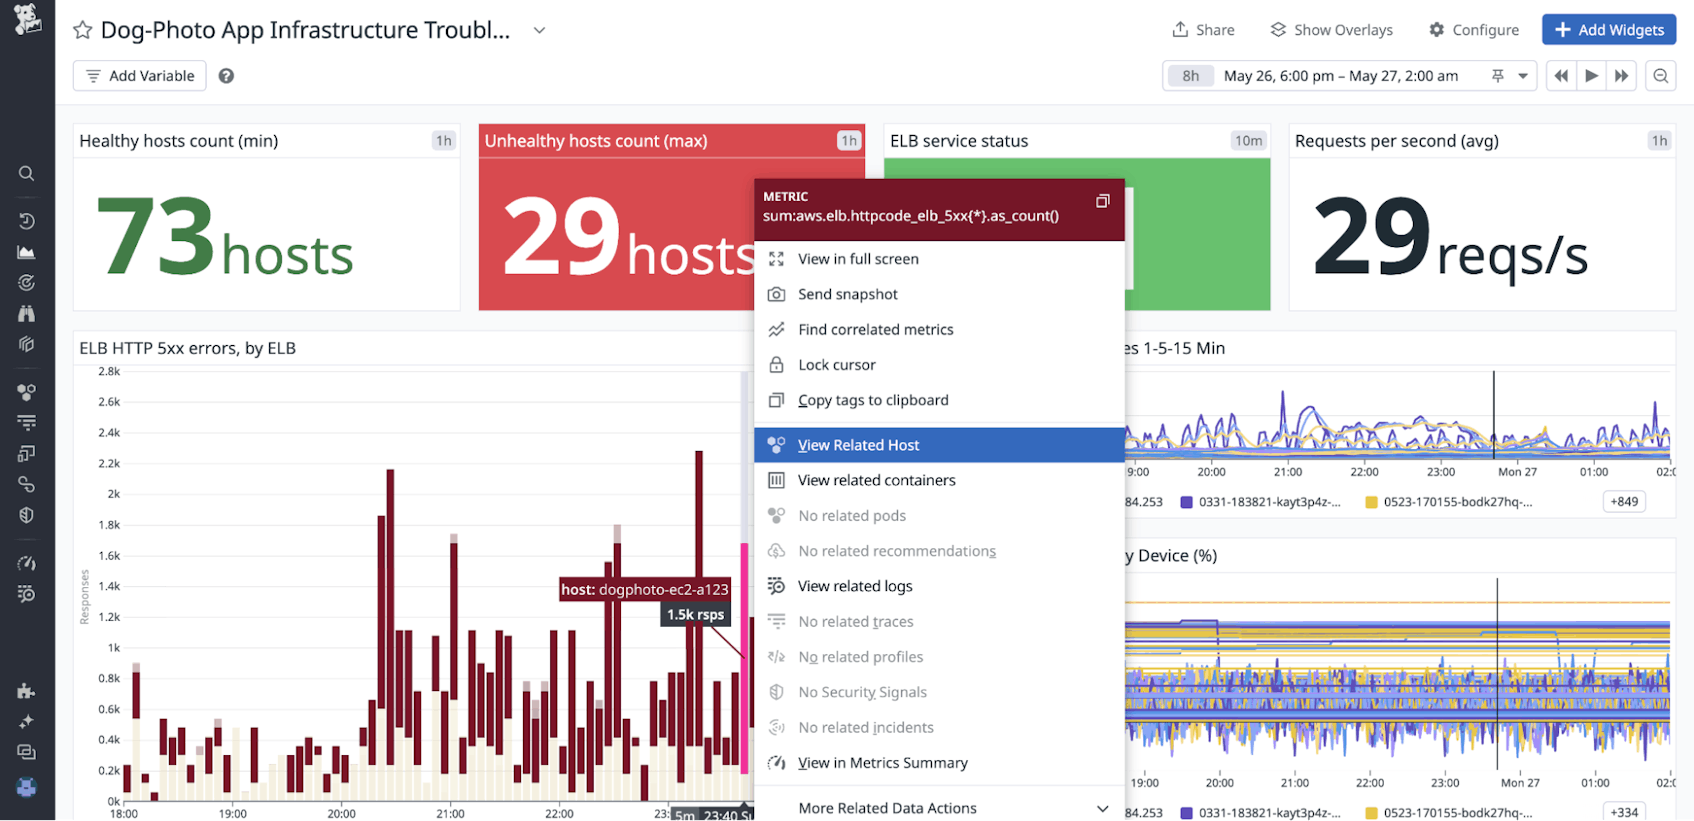
Slow Dashboard Loading
One common issue is slow dashboard loading. This can be frustrating. It often happens due to large amounts of data. Too many widgets can also cause this. To solve it, reduce the number of widgets. Filter the data to show only what’s necessary. This will speed up the dashboard.
Missing Metrics
Another issue is missing metrics. This can be critical. Missing metrics can lead to incomplete data. Check your data sources first. Ensure they are sending data correctly. Make sure the time range in the dashboard is correct. Sometimes, the problem is a simple misconfiguration.

Credit: www.datadoghq.com
Initial Diagnostic Steps
In the world of modern monitoring, Datadog stands out as a comprehensive solution. When issues arise, following initial diagnostic steps helps in quick troubleshooting. These steps ensure the basic setup is correct and the system is working as intended. Let’s dive into two crucial steps: checking network connectivity and verifying agent status.
Check Network Connectivity
Ensuring network connectivity is the first step in diagnosing Datadog issues. If your network isn’t working, Datadog can’t send or receive data.
- Use the
pingcommand to check connectivity to Datadog servers. - Ensure your firewall allows traffic to and from Datadog endpoints.
- Check DNS settings to ensure they resolve Datadog’s URLs correctly.
Command example:
ping api.datadoghq.comLook for responses from the server. If there are no responses, you might have a network issue.
Verify Agent Status
Next, verify the status of the Datadog agent. The agent collects and sends data to Datadog. If it isn’t running, data collection will stop.
- Check if the agent service is running. Use the command:
- Look for any error messages in the agent logs. Use:
- Ensure the agent is configured correctly. Verify the
datadog.yamlconfiguration file.
sudo service datadog-agent statussudo tail -f /var/log/datadog/agent.logIf the agent isn’t running, try restarting it:
sudo service datadog-agent restartCheck the status again to ensure it started properly.
Resolving Integration Problems
Resolving integration problems in Datadog can be challenging. It’s essential to ensure all components work together smoothly. This section will guide you through common issues and solutions.
Integration Compatibility
Compatibility is key for successful Datadog integrations. First, confirm the tool you’re integrating with is supported. Check Datadog’s documentation for compatibility. Outdated software versions can cause issues. Ensure both Datadog and your tool are up-to-date. If problems persist, look for known issues in Datadog’s release notes.
Api Key Issues
API key errors are common in Datadog integrations. Ensure your API key is correct and active. Double-check for any typos or extra spaces. If the key is correct but still fails, regenerate it. Go to your Datadog account settings to create a new API key. Remember to update all systems with the new key. Lastly, ensure your API key has the necessary permissions.
Credit: docs.datadoghq.com
Addressing Performance Bottlenecks
Datadog helps identify and fix performance bottlenecks in your systems. It provides real-time monitoring and detailed insights. Quickly pinpoint issues and improve efficiency with its powerful troubleshooting tools.
Performance bottlenecks can slow down your systems. They can lead to user frustration. It’s important to identify and address these issues quickly. Datadog offers tools to help you with this task. Let’s explore some ways to address performance bottlenecks.Optimize Query Performance
Inefficient queries can cause delays. They use up resources and slow down your system. To improve query performance, start by analyzing your queries. Look for queries that take a long time to execute. Identify and remove redundant or unnecessary queries.Use indexing to speed up searches. Indexes help the database find data faster. Always use indexes for columns that are frequently searched. Limit the data you query. Select only the columns you need.Reduce Dashboard Complexity
Complex dashboards can be hard to read. They can also slow down your system. Simplify your dashboards to improve performance. Start by removing unnecessary widgets. Only keep the widgets you use often.Group related metrics together. This makes it easier to find information. Avoid using too many graphs. Too many graphs can make the dashboard confusing. Use summary widgets to display key metrics. This helps you focus on important data.In summary, addressing performance bottlenecks involves optimizing query performance and reducing dashboard complexity. These steps can help you maintain a fast and efficient system. “`Fixing Alerting Issues
Alerting issues in Datadog can disrupt monitoring and hinder quick responses. Fixing these issues ensures that your team remains aware of critical incidents. This section covers common problems, such as alert configuration errors and notification delays, and provides solutions to resolve them.
Alert Configuration Errors
Misconfigurations in alert settings can lead to false alarms or missed alerts. Common errors include:
- Incorrect Thresholds: Setting thresholds too high or too low.
- Missing Conditions: Not defining all necessary conditions for an alert.
- Improper Scope: Alerts targeting wrong hosts or metrics.
To fix these issues, review and adjust your alert settings. Ensure thresholds align with your system’s baseline. Validate all alert conditions and confirm that scopes target the correct hosts and metrics.
Notification Delays
Notification delays can prevent timely responses to critical incidents. Causes of delays include:
| Cause | Solution |
|---|---|
| Network Issues | Check network connectivity and latency. |
| Email Provider Delays | Switch to a more reliable email service. |
| Overloaded Systems | Optimize and scale your alerting infrastructure. |
Resolving notification delays involves identifying the root cause and taking appropriate actions. Regularly test your notification systems to ensure timely delivery.
Handling Data Collection Challenges
Handling data collection challenges in Datadog can be tricky. Effective data collection is crucial for monitoring and troubleshooting. Issues can arise due to configuration errors or log collection problems. Understanding these challenges helps in maintaining a smooth operation.
Agent Configuration Tweaks
Adjusting the Datadog agent settings can resolve many data collection issues. Ensure that the agent is updated to the latest version. This often fixes bugs and improves performance. Check your configuration files for any errors. Small mistakes can lead to big problems. Verify that all paths and credentials are correct. Incorrect values can prevent data from being collected.
Log Collection Errors
Log collection errors can also hinder data collection. Ensure that the log sources are correctly configured. Misconfigurations can lead to incomplete or missing logs. Check the permissions for accessing log files. Insufficient permissions can block the agent from reading logs. Monitor the agent’s status and logs. They can provide clues to the root cause of collection errors.
Advanced Troubleshooting Tools
When diagnosing issues with Datadog, the right tools make all the difference. Advanced troubleshooting tools are crucial for deep dives into system behavior. They help uncover hidden issues and provide detailed insights.
Using Datadog Cli
The Datadog Command Line Interface (CLI) is a powerful tool. It allows you to interact with Datadog directly from your terminal. This can be incredibly efficient for performing quick checks and automating tasks.
To get started, you need to install the CLI. You can do this using the following command:
pip install datadogOnce installed, configure the CLI with your API and application keys:
datadog config set --api-key --app-key Here are some common commands:
- Check metrics:
datadog metric show - List hosts:
datadog host list - Manage dashboards:
datadog dashboard create
The CLI provides a direct, scriptable way to interact with Datadog. It is a useful tool for quick troubleshooting.
Leveraging Datadog Api
The Datadog API offers extensive capabilities. You can access almost all Datadog features programmatically. This is ideal for integrating Datadog with other tools or creating custom solutions.
To use the API, you need your API and application keys. These keys authenticate your requests. Here is a simple example of how to use the API with Python:
import requests

api_key = 'your_api_key'
app_key = 'your_app_key'
url = 'https://api.datadoghq.com/api/v1/hosts'

params = {
    'api_key': api_key,
    'application_key': app_key
}

response = requests.get(url, params=params)
print(response.json())
This script retrieves a list of hosts monitored by Datadog. You can modify it to suit other needs. The API documentation provides many more examples.
Using the API, you can automate complex tasks. This can save a lot of time and reduce human error.
Best Practices For Preventive Maintenance
Best practices for preventive maintenance in Datadog can help ensure your systems run smoothly. Regular health checks and proactive monitoring strategies are key. These practices not only help in identifying issues early but also prevent potential downtimes.
Regular Health Checks
Regular health checks are essential for maintaining system integrity. Checking your system’s performance at regular intervals helps spot issues early. This can include monitoring CPU usage, memory, and disk space. Ensure that all components are working as expected. Regularly update your software and security patches. This keeps your systems secure and efficient.
Proactive Monitoring Strategies
Proactive monitoring strategies involve setting up alerts and notifications. This helps you stay informed about the health of your system in real-time. Create custom dashboards to track key metrics. Use anomaly detection to identify unusual patterns. This can prevent issues before they affect users. Implementing these strategies can save time and resources.
Frequently Asked Questions
What Is Datadog Used For?
Datadog is used for monitoring and analyzing cloud applications. It helps track performance and detect issues.
How Can I Troubleshoot Datadog Agent Issues?
Check the agent status and logs. Ensure correct configurations. Restart the agent if needed.
Why Is My Datadog Dashboard Not Loading?
Possible reasons: browser issues, network problems, or Datadog service disruptions. Clear cache and refresh.
How Do I Monitor Logs In Datadog?
Use the Datadog Log Management tool. It collects, searches, and analyzes logs in real-time.
What To Do If Datadog Metrics Are Missing?
Ensure the integration is set up correctly. Check for network or configuration issues. Verify permissions.
Conclusion
Troubleshooting with Datadog can streamline your monitoring efforts. It helps detect issues quickly. Clear insights lead to faster solutions. Your systems run smoother and more efficiently. Datadog’s tools make problem-solving easier. You gain better control over your infrastructure. Regular monitoring ensures fewer surprises.
Always stay proactive. Enhance your workflow with consistent checks. Embrace Datadog for effective troubleshooting. Happy monitoring!
")